How to Interpret Histograms
How to Interpret Histograms
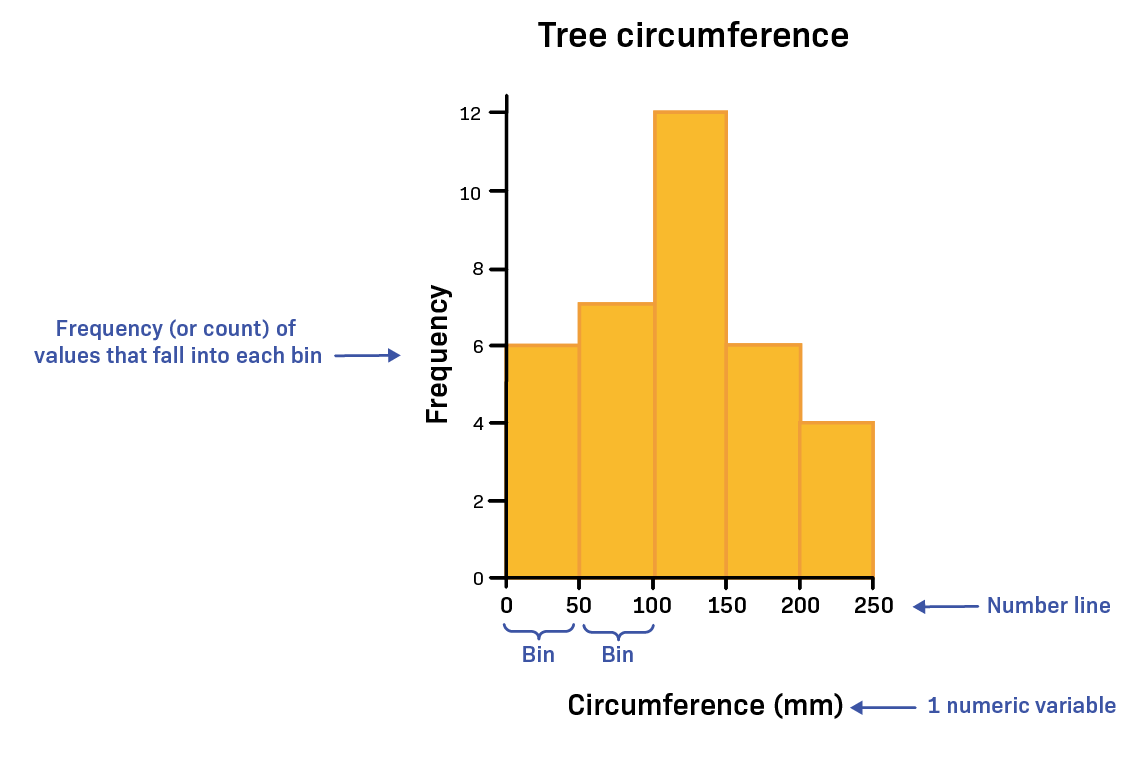
Histograms are particularly useful for understanding the shape of the data distribution. A histogram graphically shows how frequently every value in a data set occurs in a relatively objective way. Histograms make it easy to see which values are most common and which values are least common. In a histogram, the type of data being measured is represented on the horizontal axis, and the vertical axis represents how many observations are in each bin.
Text above
title 1
You can write anything within the body text of these cards. Use a layout like this to outline 2 - 4 core constituents of a concept. As a general rule, try to not exceed more than 7 lines worth of type (including line breaks).
title 2
You can write anything within the body text of these cards. Use a layout like this to outline 2 - 4 core constituents of a concept. As a general rule, try to not exceed more than 7 lines worth of type (including line breaks).